Well, seems you can't trust an Atlas these days, thanks to the "consensus."
Here' the whole thing for those too lazy to clicky on the linky:
Times Atlas is 'wrong on Greenland climate change'
Glaciologists say the ice cover is melting – but at nowhere near the 'misleading' 15% rate represented by cartographers
- guardian.co.uk,
- Article history
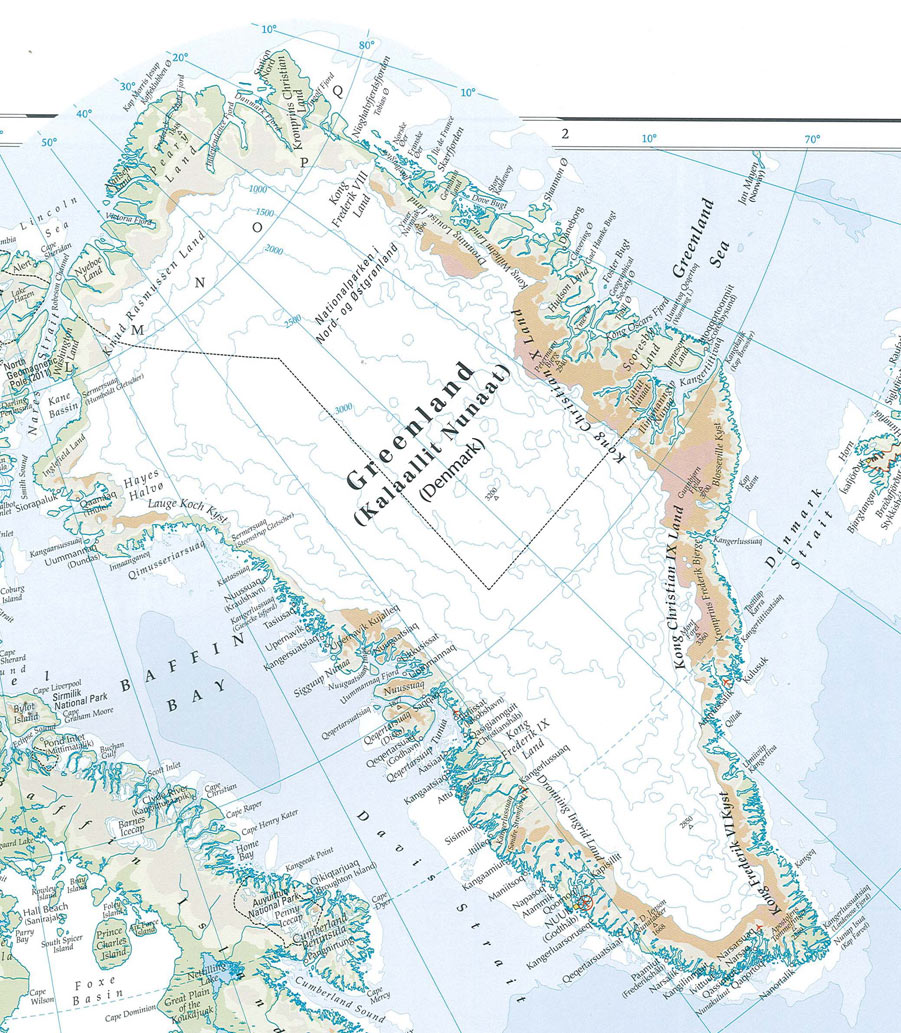
The Times Comprehensive Atlas of the World shows Greenland as having lost around 15% of its ice cover between the 1999 10th edition (left) and 2011 13th edition (right). Scientists argue the depiction is wrong. Photograph: Times Comprehensive Atlas of the World
Leading scientists have accused the world's top cartographers of making a blunder in their representation of the effects of climate change in Greenland, prompting a robust defence by the map-makers' publisher. Maps in the 13th edition of the Times Comprehensive Atlas of the World, published last week, show large areas of the eastern and southern coasts of Greenland coloured brown and pink, and the permanent ice cap now covering a significantly smaller area than it did in the 1999 12th edition of the atlas. The atlas suggests that 300,000 sq km, or 15%, of Greenland's ice cover had been lost in the period. "This is concrete evidence of how climate change is altering the face of the planet forever – and doing so at an alarming and accelerating rate," said the publishers of the atlas, HarperCollins, in information given to the media last week and reiterated by a spokeswoman on Monday. But seven researchers at Cambridge University's Scott Polar Research Institute backed by glaciologists in the US, Europe and elsewhere, have said that both the maps and the figure of 15% are wrong. In a letter to the editors of the Times Atlas they agree that the Greenland ice cover is reducing but at nowhere near the extent claimed in the book. "A 15% decrease in permanent ice cover since the publication of the previous atlas 12 years ago is both incorrect and misleading. "Numerous glaciers have retreated over the last decade. Because of this retreat, many glaciers are now flowing faster and terrain previously ice-covered is emerging along the coast – but not at the rate suggested. Recent satellite images of Greenland make it clear that there are in fact still numerous glaciers and permanent ice cover where the new Times Atlas shows ice-free conditions and the emergence of new lands." According to the researchers, the volume of ice contained in the Greenland ice sheet is approximately 2.9m cubic kilometres and the current rate whereby ice is lost is roughly 200 cubic kilometres per year – a decrease of about 0.1% by volume over 12 years. Other researchers backed the Scott team. "Although many of these regions have decreased in area and thickness over the past decade(s), reported in many recent scientific papers, the misinterpretation of enormous losses of glacierised area from these maps is far off the range in measured losses," said Hester Jiskoot, a glaciologist at the University of Lethbridge in Alberta. "A number like 15% ice loss used for advertising the book is simply a killer mistake that cannot be winked away," said Jeffrey Kargel, a senior researcher at the University of Arizona. Several researchers said the atlas's authors may have confused ice thickness with ice extent, defining the ice sheet margin at 500m high (the contour) and colouring brown and pink anything below 500m. "They [seem to] show the contour as ice thickness, colouring in everything white that is above 500m. They appear to have missed out the edge of the ice sheet," said Ian Willis, researcher at the Scott institute. A spokeswoman for Times Atlas defended the 15% figure and the new map. "We are the best there is. We are confident of the data we have used and of the cartography. We use data supplied by the US Snow and Ice Data Centre (NSIDC) in Boulder, Colorado. They use radar techniques to measure the permanent ice. We have compared the extent of the ice surface in 1999 with that of 2011. Our data shows that it has reduced by 15%. That's categorical," she said. "You will always have a level of generalisation. But we have compared like with like. The same criteria were applied to the 1999 data to that of 2011. "We are not saying that all of the ice loss is due to climate change. It is the lion's share but the data has improved over the period." The NSIDC said it was investigating the claims made by the Times Atlas. The row echoes a 2010 flare-up, when the UN's climate science body admitted that a claim made in its 2007 report – that Himalayan glaciers could melt away by 2035 – was unfounded. The claim was not based on peer-reviewed scientific literature but a media interview with a scientist.
 Now, let us take this moment to remember Leif Ericson and his life in this land they named Greenland, as well as his journeys to Vinland with it's almost frost-free winters and green grass year round...the only certain site being the northern tip of Newfoundland but some possibility of the St. Laurence River area indicating it was warmer 1000 years ago than it is today.
No comments:
Post a Comment